
Introducing Apache Druid® 32.0


Apache Druid® is an open-source distributed database designed for real-time analytics at scale.
We are excited to announce the release of Apache Druid 32.0. This release contains over 341 commits from 52 contributors. It’s exciting to see a 30% increase in our contributors!
Druid 32.0 is a significant release focusing on stability, performance, and moving experimental features forward.
Druid 32 introduces a key new feature – Projection, that can help you significantly improve query performance by pre-computing aggregations.
Distributed Embedded Projection
How can your dashboards load in seconds instead of minutes when there are billions of rows? One key trick is pre-computed aggregation or materialized views in traditional databases.
However, building materialized views in a distributed database is hard. The distributed nature of the data can lead to incorrect results due to a variety of conditions, such as intermittent network issues, node failures, cluster scaling or upgrades, etc.
In this release, Druid introduces Distributed Embedded Projection (Projection abv.) that enables pre-computed aggregation while maintaining data consistency.
The most important part is the performance impact:
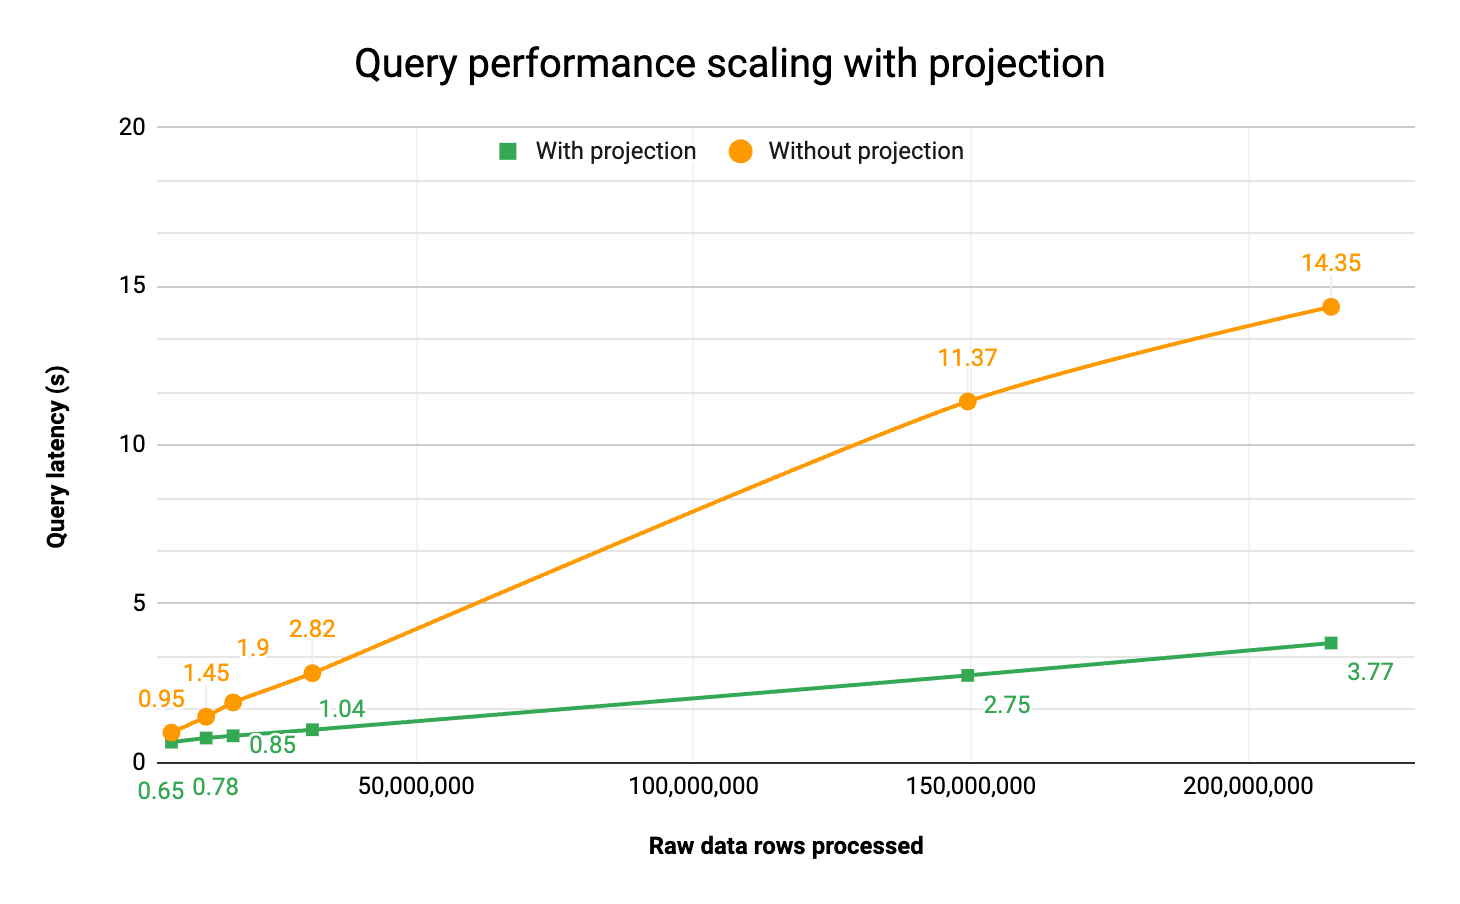
As you can see, as the data required to fulfill a query scales up, projection is able to maintain a much flatter latency curve.
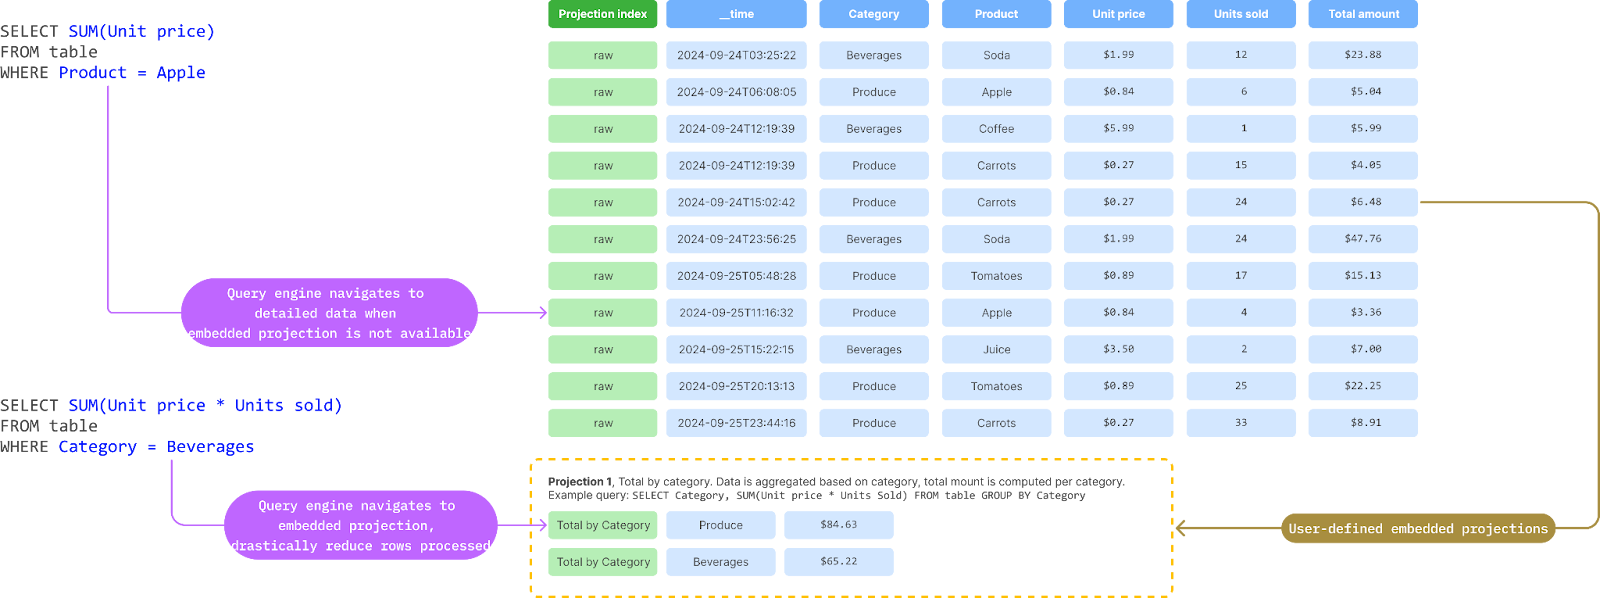
It works by intelligently routing queries to pre-computed aggregates. Each table can contain more than one projection and the historical nodes will find the lowest cost one to fulfill the query fragment it receives.

Conceptually, Projection acts like a series of “mini-rollups” inside the same segment file. Below is a diagram of how a subset of columns and different time granularity is made into a projection.
Iceberg AWS Glue support
In Druid 30, we’ve introduced Iceberg table format support. The initial version requires either the HiveMetastore or Iceberg local catalog. In this release, we are adding AWS Glue catalog support. This is also the first REST catalog we are supporting, paving the way for supporting other REST-based catalogs in the near future.
With the support of the Iceberg table format, you can easily ingest data from Iceberg, as well as query Iceberg as external tables without ingestion.
Deltalake improvements
Similar to Iceberg support, in Druid 29, we’ve introduced support for Deltalake as well. Over the past few releases, we’ve been steadily improving the integration with Deltalake. With added support for pushing down column selection to the file access layer, this substantially reduces the amount of data processed during query. In this release, we’ve addressed other issues on snapshot access, as well as decimal ingestion support.
We aim to remove the experimental tag on Deltalake in the near future. We encourage you to try out Deltalake integration and provide feedback on functionality and usability via Slack or Github.
MSQ Join hints
SQL-based ingestion has been the recommended solution for batch ingestion into Druid. This includes support to load data from Iceberg, Deltalake and a variety of sources. During ingestion, it’s very common to enrich and denormalize the data through a range of joins. Druid supports two kinds of joins, optimized for different queries:
| Join type | How it works | Suitable for |
| Broadcast | Broadcast complete copy of dimension tables in joins to all processing nodes. | Fact(Big table)-Dimension(Small table) join |
| Sort merge | Only send data required for the small join batch to the required nodes | Fact(Big table)-fact join |
What if you want to do both dimension-fact join and fact-fact joins in the same query? This is where join hints come in. For each join in a query, you can “hint” the engine by specifying the algorithm to use ー allowing a single query to operate both efficiently and scale out.
SELECT
/*+ sort_merge */ w1.cityName, w2.countryName
FROM
(
 SELECT
/*+ broadcast */ w3.cityName AS cityName,
w4.countryName AS countryName
 FROM wikipedia w3
 LEFT JOIN wikipedia-set2 w4
 3ON w3.regionName = w4.regionName
) w1
JOIN wikipedia-set1 w2 ON w1.cityName = w2.cityName
where w1.cityName='New York'
Explore view
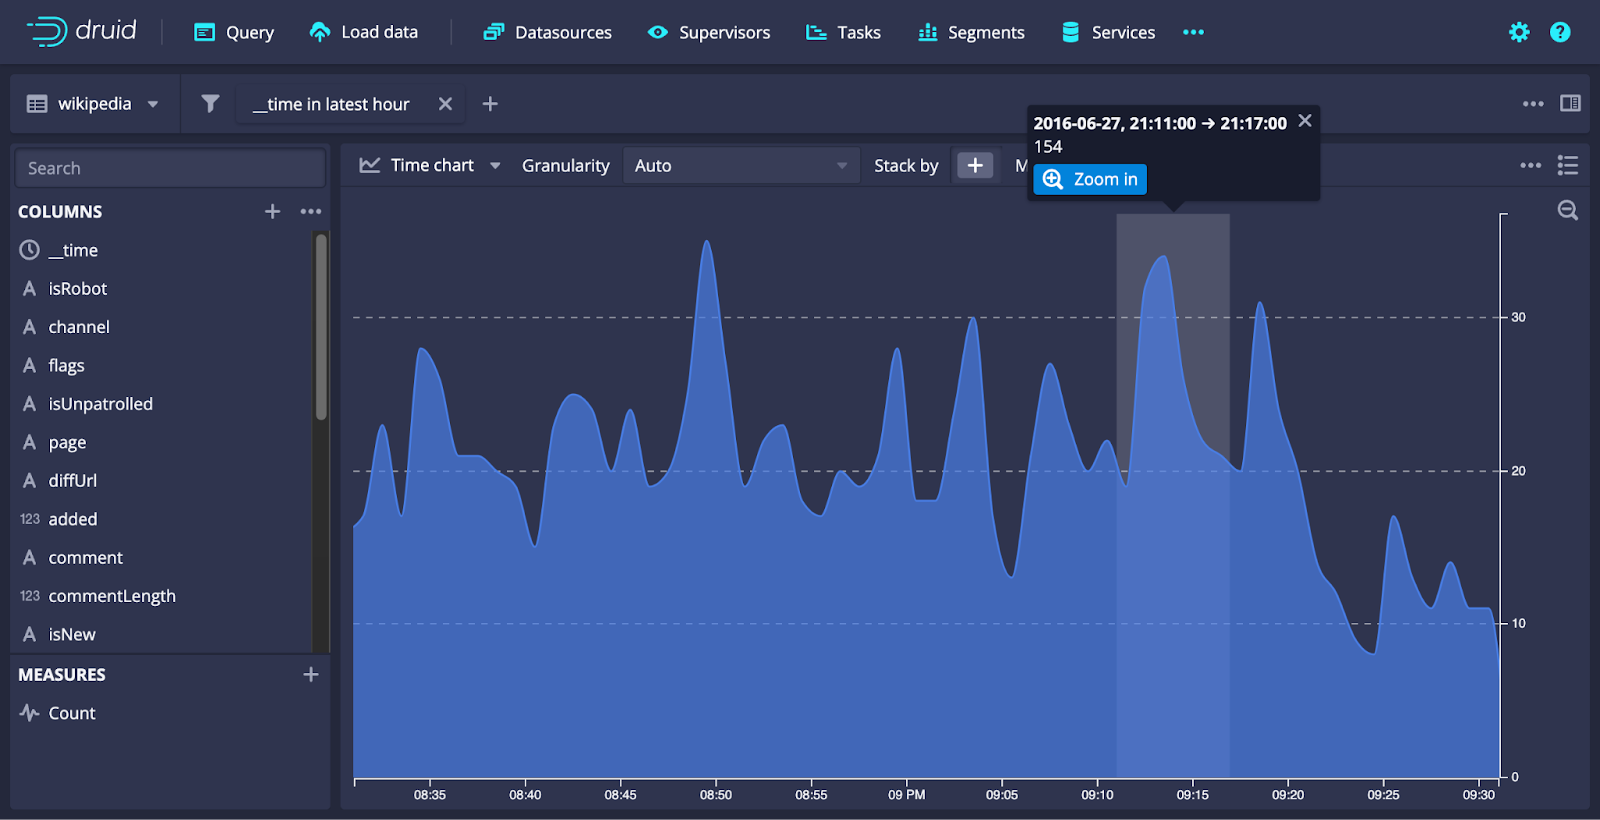
Switching gears, let’s look at the UI enhancements. In Druid 28, we introduced Explore view, an interactive dashboarding tool to allow you to quickly visualize Druid data in the web console. In this release, we’ve added a few other enhancements to the Explore view.
Filter helpers on the right to help you choose WHERE clause filters quickly with real data. (And stats!)
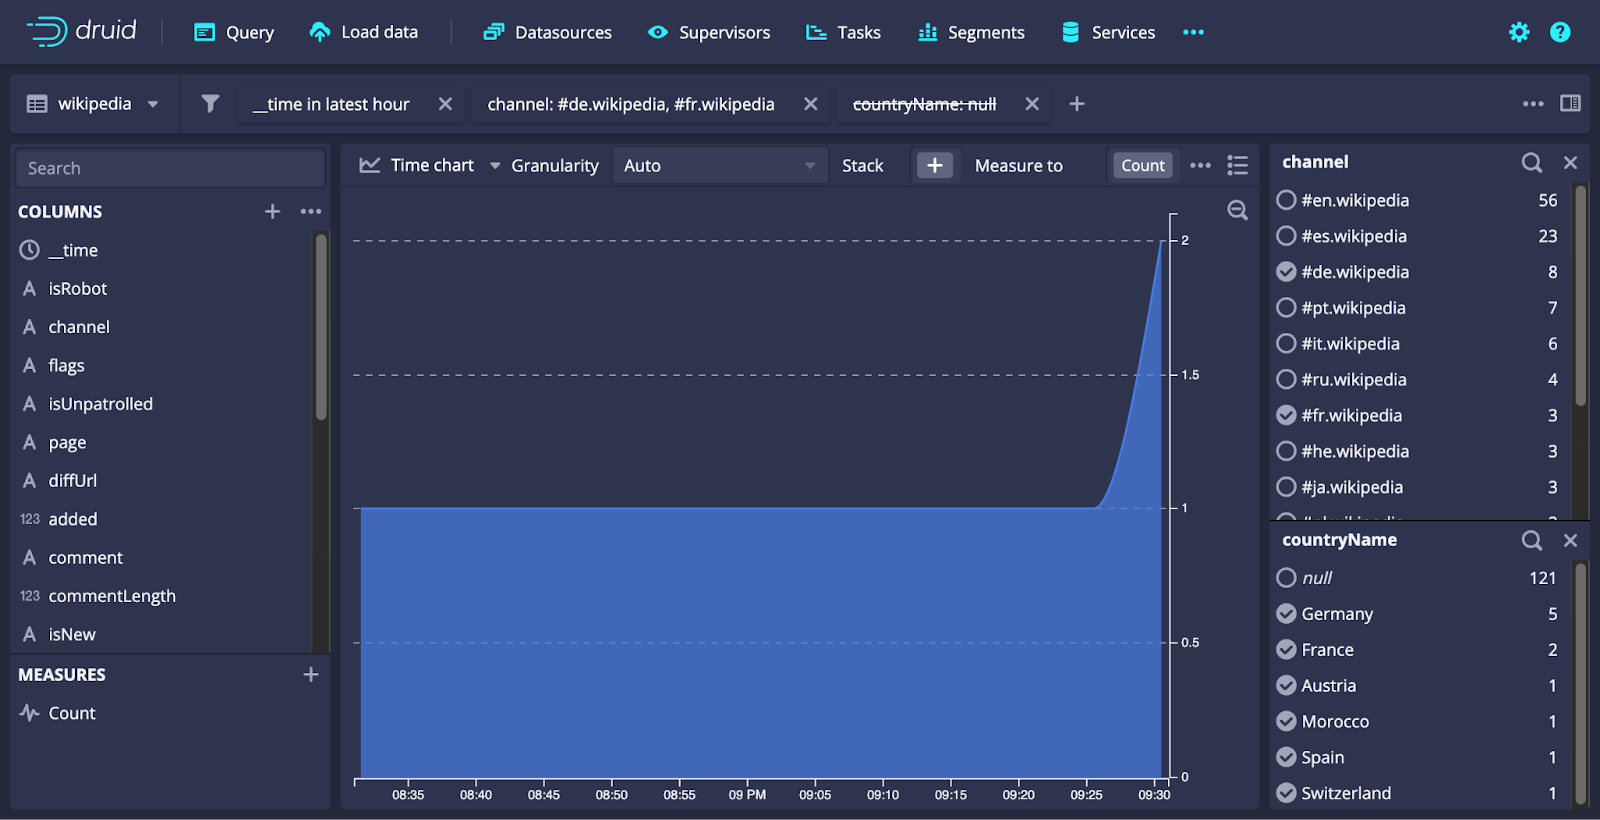
Side-by-side tiles allow you to mix and match various visualization types.

Lastly, a nifty zoom tool allows you to easily adjust the time range on time charts.
Segment timeline view
Segment timeline is an essential tool for any Druid cluster operator. Knowing where your data lives and understanding its distribution allows operators to proactively act on fragmentation and data skew issues before they impact query performance. The new segment timeline view is a lot more flexible. The DateTime selection is a lot more dynamic and allows you to view the segment timeline with different time granularity.

Other highlights
In addition to the above features, there are a few other impactful improvements.
Auto-guess numbers for CSV/TSV
This makes ingesting numbers from CSV/TSVs much less of a guessing game. By enabling the tryParseNumbers flag during ingestion, the ingestion engine will automatically map integers to long and floating point numbers to double.
gRPC/protobuf support for SQL queries
gRPC/Protobuf is an efficient API protocol. It uses very little bandwidth and is suitable for high concurrency workloads. But gRPC also has strict schema requirements. Thus, it’s mostly ideal for building APIs with fixed query result shapes.
To use gRPC, you can use the following code example:
QueryRequest.newBuilder()
            .setQuery("SELECT * FROM foo")
            .setResultFormat(QueryResultFormat.CSV)
            .setQueryType(QueryOuterClass.QueryType.SQL)
            .build();
This outputs the result in CSV format as a blob. You can also use protobuf by switching to
.setResultFormat(QueryResultFormat.PROTOBUF_INLINE)ZGC support
Lastly, Druid now officially supports ZGC, a garbage collector introduced in Java 11. By default, Druid uses G1GC, which is optimized for mixed workloads. ZGC has seen promising results in reducing latency as well as working well on large heap settings. If you believe you have a stable workload that’s highly concurrent, with relatively fixed query shapes and strong low latency requirements, ZGC is definitely an option you can consider.
Try this out today!
For a full list of all new functionality in Druid 32.0.0, head over to the Apache Druid download page and check out the release notes.
Try out Druid via Python notebooks in the Imply learn-druid Github repo.
Alternatively, you can sign up for Imply Polaris, Imply’s SaaS offering that includes Druid 31’s production quality capabilities and a lot more.
Stay Connected
Are you new to Druid? Check out the Druid quickstart, take Imply’s Druid Basics course, and head to the resource-packed Developer Center.
Check out our blogs, videos, and podcasts! Join the Druid community on Slack to keep up with the latest news and releases, chat with other Druid users, and get answers to your real-time analytics database questions.
Related articles
More from Imply on the same topic.

Search your Splunk DDSS archive without restoring it
Security teams often keep logs long after they have aged out of their SIEM platform’s searchable window. The data is there for investigations or audits, but accessing the data for insights can be complicated.

Claude makes dashboards now, Lumi is ready for them
This week Anthropic launched Claude Dashboards in beta. You connect a data source, ask a question in plain language, and Claude writes the queries and builds the dashboard.

Lumi Lounge Recap: 3 Takeaways from Splunk .conf26
The Imply Lumi Lounge sat directly across the street from Splunk .conf26 and reached venue capacity on both days. Digital signs around the Colorado Convention Center pointed attendees our way with a simple message: “Federated search, done right. Full SPL. Less spend.”

Agents don’t query like your detections do
A security team of four has run a major SIEM since February. Nobody on the team writes SPL. Nobody opens the console or looks at the dashboards. Every question goes through an AI agent, which writes the query, runs it, reads the result, and answers in plain language.

Why You Shouldn’t Have to Delete Your VPC Flow Logs
When a security incident happens, investigators almost always start with the same questions: Which systems communicated? Where did the traffic originate? What changed before the incident? Was data exfiltrated? AWS VPC Flow Logs are often the fastest way to answer those questions.

Splunk Smartstore vs Lumi Loglake: Two Very Different Ways to Search Logs in Object Storage
One copies data back before it can be searched. The other queries it where it lives. Lumi Loglake lets Splunk teams query logs directly in object storage, including AWS S3, Delta Lake, Apache Iceberg, using standard SPL.
Supercharging Schema-On-Read: Logs in Object Storage Don’t Need a Data Catalog
Machine data architectures are rapidly changing. As telemetry volumes continue to grow and as costs rise, organizations are increasingly moving logs and other machine data into object stores such as AWS S3.

Imply Lumi Loglake vs Splunk Federated Search for S3
Teams are increasingly moving log data into AWS S3 to reduce costs and extend retention. Both Lumi Loglake and Splunk Federated Search to S3 help you query data in AWS S3 to lower costs, however the two technologies have several notable differences.

A First Look at Lumi Loglake: Query Logs Where They Live
TL;DR: Imply Lumi Loglake is a lakehouse (separated compute/storage) architecture for unstructured logs that reduces costs from 40% up to orders of magnitude on your hardware/AWS/Azure bill used to run your SIEM/observability products.

Imply Lumi Major Release Preview: Continuing the Journey Towards Decoupled Observability/SIEM
We are getting ready to introduce the next major expansion of Imply Lumi and the observability warehouse. When we introduced the industry’s first observability warehouse, the goal was clear: decouple the observability stack by separating storage, compute, and access.

Query Lumi from Grafana: Now in Private Preview
Observability has a silo problem. Today, we’re removing another one. Imply Lumi’s Grafana Loki integration is now in Private Preview.
